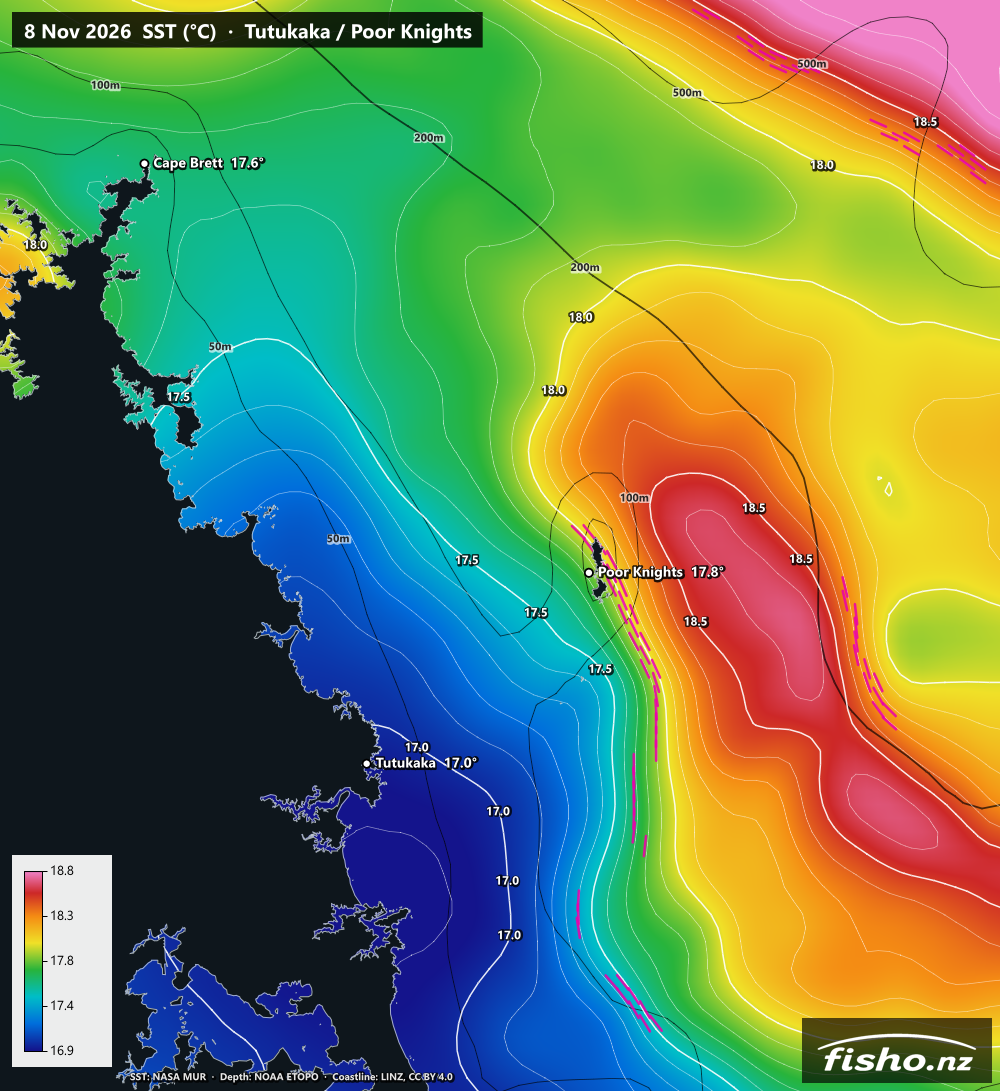
Bait and predators love a temperature break, where warm and cool water meet. Now you can see exactly where those breaks are before you leave the ramp. Our sea surface temperature charts are zoomed right in on 11 key fishing areas, with sharp colours, a proper NZ coastline, depth contours and the fronts marked for you. Have a look at Tutukaka / Poor Knights or Bream Bay / Hen & Chickens, or pick your area from the Sea Temp page.
They're free for registered Fisho members. Sign in and you're away.
How to read a chart
- Colours: each chart is tuned to that area's own temperature range for the day, often only about 2°C top to bottom. That's why small local differences jump out. It also means you can't compare colours between areas or days, so check the colour key and read the numbers.
- Thin white lines: temperature contours, usually every 0.1°C.
- Thick white lines with labels: every 0.5°C, labelled (e.g. 17.5) so you can read it at a glance.
- White lines bunched up together: the temperature is changing fast over a short distance. That's a temperature break.
- Pink dashes: fronts. We automatically mark the strongest temperature breaks in each area for that day. Fronts are where warm and cool water meet, and where bait and predators often gather.
- Thin black lines: depth contours at 50, 100, 500, 1000 and 2000 m.
- Heavy black line: the 200 m shelf edge. A front sitting along the shelf edge, a pinnacle or a canyon is a classic spot to look at.
- Place markers: named spots like the Poor Knights, Hen & Chickens, Mokohinau and Cape Brett show the water temp right there.
- Tap anywhere on the sea to drop a pin and get the exact temperature at that point.
You can also browse back about 30 days of charts to see how the water's been moving.
The date thing (yes, it does everyone's head in)
The data comes from NASA's MUR satellite analysis, served by NOAA. It's one value per day for each square kilometre of ocean: the steady temperature just below the surface, not a one-off snapshot. It blends several satellites, including ones that see through cloud.
Two things make it look older than it is:
- NASA works in UTC days. We're 13 hours ahead in summer, so a chart dated 8 Nov actually covers about 1pm Sunday 8th to 1pm Monday 9th, NZ time. In other words, NZ is effectively +1 day on the label.
- It takes NASA about a day to process. Each new day lands on Fisho at about 11pm. Between 11pm and midnight it's yesterday's water. After midnight the label looks two days old, until the next one drops at 11pm.
Every service using this data has the same lag. It's just how the satellite data works, and we'd rather be straight with you about it.
Why your boat reads 15° and the chart didn't?
The chart isn't a live reading. It shows the "foundation" temperature: the steady water just below the surface, before the sun warms the top layer. Think of it as roughly what you'd read at dawn.
Your sounder reads one spot at one moment. On a calm, sunny afternoon the top metre can warm up by 1–2°C, so it's normal to see more than the chart. Other reasons the two can differ:
- Timing: the chart is a daily value. A tide change or a front moving through can shift the water within hours.
- Cloud: under cloud, the chart leans on the coarser satellites that see through it and fills the gaps, so it's smoother and less exact.
- Close to shore: right inshore, in bays and near river mouths, satellite data is least reliable.
- Your sensor: a transducer temp can be off by half a degree or more, and a hull sitting in the sun warms it up.
Use the chart for the pattern: where the warm water sits and where the breaks are. Use your sounder for what's under the boat right now. If they're a degree or so apart, both are usually right.
What it isn't
Just so nobody's caught out: these are surface temperatures only. There are no forecasts, no live readings, no currents, no chlorophyll and no "fish here" spots. The depth lines are for reading the temperature, not for navigation. For wind, swell and tides, check the Fisho Factor.
Give it a whirl and tell us what you reckon
We want to hear from you:
- Did you use it? Was it useful on the water?
- Catch something? Send us a photo of the fish with the chart from that day. We'd love to share them.
- Want your area added? We've started from the central North Island up and can add more easily.
- Anything confusing, broken or missing? Tell us.
Drop us a line through Contact Us, or comment on our Facebook page. Get out there and enjoy it.
Credits: sea surface temperature from NASA JPL MUR SST via NOAA CoastWatch ERDDAP. Depth from NOAA ETOPO. Coastline sourced from the LINZ Data Service and licensed for reuse under CC BY 4.0.